September 29, 2020 International Agricultural Trade Reports
https://www.fas.usda.gov/data/china-evolving-demand-world-s-largest-agricultural-import-market While
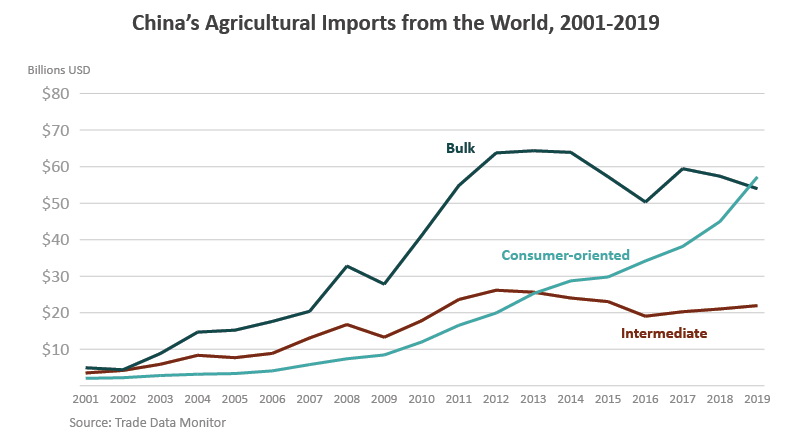
trade tensions and Chinas retaliatory tariffs slashed U.S. agricultural exports to China in 2018 and 2019, Chinas agricultural purchases from the rest of the world continued apace. China is now the worlds largest agricultural importer, surpassing both the European Union (EU) and the United States in 2019 with imports totaling $133.1 billion. Whats more, the composition of Chinas imports is also rapidly changing. Whereas bulk commodities once dominated, higher-valued consumer-oriented products are now surging ahead, eclipsing the former for the first time in 2019. While implementation of the U.S.-China Economic and Trade (Phase One) Agreement and the economic response to Covid-19 currently overshadows the trade landscape, the biggest challenges facing U.S. agricultural exports in China are more competition from other suppliers and U.S. agricultures ability to meet increasingly diverse Chinese import needs.
Market Overview
Rising income and living standards, increasing urbanization, and food safety concerns have fueled Chinas agricultural imports, especially since the countrys accession to the World Trade Organization (WTO) in 2001. As incomes rose, the average Chinese diet changed to include more meat, dairy, and processed foods, while grain consumption declined. Between 2000 and 2019, per capita consumption of poultry meat increased 32 percent, soybean oil consumption more than quadrupled, and fluid milk intake more than tripled.1
As a relatively
land-scarce country (per capita arable land is less than
one-fifth of that in the United States), during the first decade following its WTO accession,
land-intensive bulk commodities, such as soybeans, sorghum, and cotton drove Chinas agricultural imports. China has been producing most of the meat it consumes, and this dietary change has drawn more of the countrys land into feed production. However, domestic feed supplies have been unable to keep up with soaring demand, and imports of soybeans and other feed ingredients expanded rapidly.
Around 2012, however, the countrys bulk import value reached a turning point and stopped growing. This changing trend coincided with a significant slowdown in Chinas economic growth. Soybean imports have been flat since that time. Cotton imports dropped off precipitously from a peak of $11.9 billion in 2012, during a period when China stockpiled domestic cotton to support prices and cheaper imports of cotton surged to meet textile demand.2 Chinas policy to support producers income through minimum purchasing prices has also led to stockpiling of wheat, rice, and corn in state reserves. Since 2014, corn stocks have amounted to over 60 percent of the worlds total. To dispose of the large corn stocks, the government had been auctioning off corn at below acquisition cost in recent years, while discouraging imports of corn and corn substitutes with various measures favoring utilization of domestic grains. Some of these measures may have gone too far, though, as anti-dumping duties on U.S. distillers dried grains with solubles (DDGs) and Australian barley have limited feed mills options for feedstuff as the country rebuilds its hog sector from the outbreaks of African Swine Fever (ASF) at a faster-than-anticipated pace. This has led Chinas imports of grains to rebound so far in 2020 as it also seeks to >protect itself from distribution chain disruptions caused by the Covid-19 pandemic and make good on pledges to buy more U.S. crops under the Phase One Agreement.
Chinas imports of intermediate products have declined since 2012. Palm oil, soybean oil, and hides and skins imports dropped the most. The decline in palm oil and soybean oil imports is partly due to an excess domestic processing capacity and oversupply. As world demand for leather has softened in recent years, so have Chinas imports of hides and skins used in the apparel and automotive industries. In addition, some of the leather industry has moved from China to Southeast Asia and elsewhere, further reducing Chinas demand for hides and skins.
In contrast, imports of consumer-oriented products continued expanding, led by meat, dairy, and horticultural products. Rising demand, slow growth in domestic supply, and growing costs of feed, labor, and land are pushing domestic meat and dairy prices higher, which makes imported meats more competitive in China.3 More recently, ASF has disrupted the domestic pork supply and led to price increases in all types of animal proteins and an overall sharp rise in food prices in 2019, further fueling protein imports. China is the worlds largest pork market with imports of $6.4 billion in 2019. The EU and the United States are the top suppliers, with market share of 63 percent and 16 percent in trade value, respectively. Brazil, which did not start shipping substantial quantities of pork products to China until 2016, quickly rose as the third largest pork supplier with a 9-percent market share.
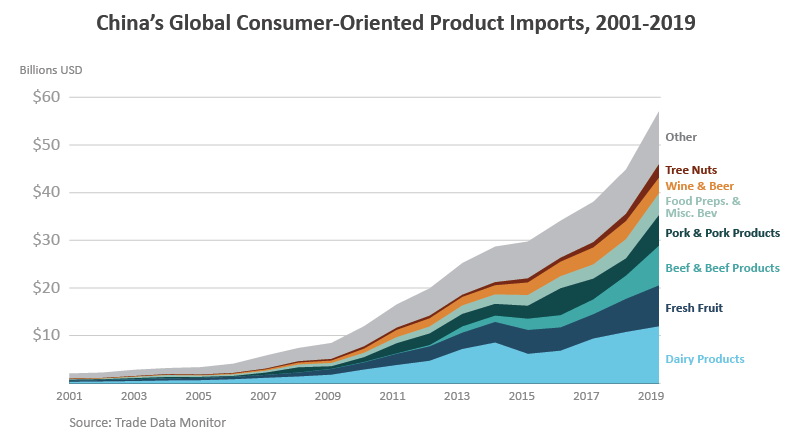
With rising consumption and very limited capacity to grow domestic beef production, China increasingly meets its beef demand through imports. Beef and beef product imports have grown exponentially since 2012, with an annual trend of 48 percent, propelling it to surpass the United States and become the largest beef market in 2019 with imports at $8.4 billion. Top suppliers are Brazil, Australia, and Argentina, with market shares of 25 percent, 21 percent, and 21 percent, respectively.
China is also the worlds top market for dairy imports, valued at $12.0 billion in 2019. The countrys consumption of dairy products is growing rapidly from a historically low base, making China the most dynamic segment of the global dairy market.4 Estimated per capita consumption is currently 35 kilograms per year, compared to 300 kilograms in Western Europe. Ultra-High Temperature (UHT) prepackaged milk and whole milk powder are major components of Chinas dairy imports, but the real driver of import expansion in recent years has been infant formula. Despite government efforts to tighten regulations and industry consolidation following the 2008 melamine scandal, food safety concerns for domestically produced infant formula linger and underpin consumer preference for foreign supplies. In 2012, China reduced the import tariff of special infant formula from 10 percent to 5 percent. Two years later, the government also approved cross-border e-commerce channels where consumers could directly order products from abroad at a lower tax rate. Infant formula imports rose meteorically after 2014, while other powdered products fell off. In 2008, infant formula accounted for 28 percent of Chinas dairy imports. That share rose to 45 percent in 2019. Top dairy suppliers to China are the EU and New Zealand. The EU dominates Chinas infant formula market, with an overall dairy market share of 45 percent. New Zealand has expanded sales under its free trade agreement with China and now enjoys a 40-percent market share.
Increasing demand for healthy foods is driving higher fruit and tree nut sales. China is the worlds third largest fresh fruit importer, with imports valued at $8.6 billion in 2019. Durians, cherries, and bananas account for nearly half of all fresh fruit imports. Thailand, Chile, and Vietnam are the largest suppliers. Consumers are increasingly aware of the health benefits of tree nuts and, according to importers in China, consider them an «honest» food that is difficult to adulterate. Chinas tree nut imports have sustained a 26-percent annual trend growth since 2001, reaching $2.8 billion in 2019. The United States is the largest supplier with a market share of 30 percent, followed by Australia (14 percent) and Vietnam (12 percent).
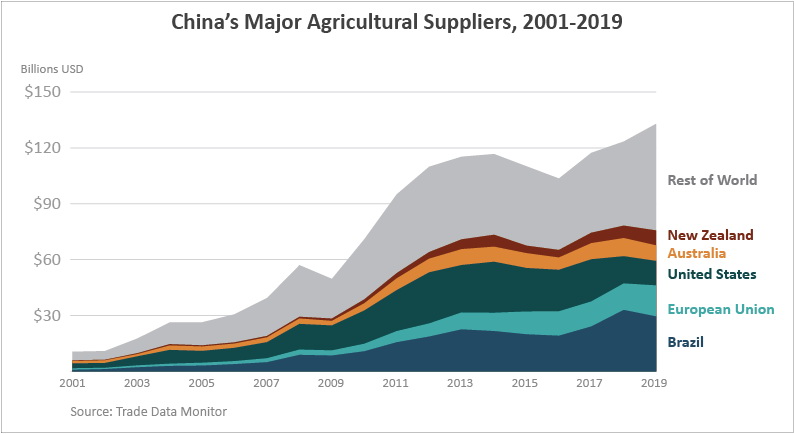
The United States used to be Chinas largest agricultural supplier but was overtaken by Brazil and, more recently, the EU. About 85 percent of Brazils exports to China consist of soybeans, although meat exports from Brazil are also seeing rapid growth. Over 80 percent of Chinas imports from the EU are consumer-oriented products, led by dairy and pork. Other top suppliers include Australia and New Zealand, both free trade agreement partners with China.
U. S. Exports to China
Starting in the 1990s, U.S. exports benefited from Chinas policy strategy of allowing imports of land-intensive feeds and industrial raw materials. In recent years, as Chinas livestock industry has hit a ceiling on its growth and consumers have more purchasing power, there has been a shift from importing raw materials toward importing meat, dairy, and other value-added products. U.S. agricultural exports to China peaked in 2012 at $25.9 billion with a market share of 25 percent. Both figures have been in decline since then. A strong U.S. dollar, lagging compliance with Chinas import requirements, especially for value-added products, and Chinas effort to diversify its agricultural suppliers have all been contributing to the decline. More recently, trade tensions and retaliatory tariffs have led to further slides in market share. U.S market share dropped 9 percentage points between 2017 and 2019 to 10 percent, the lowest in 20 years based on available data.
Feed ingredients destined for the livestock and poultry industries dominate U.S. exports to China. On average, soybeans have accounted for over 50 percent of U.S. agricultural shipments there since 2001. U.S. soybean exports have lost ground to Brazilian supplies as the latter expands production and maintains price competitiveness on a favorable exchange rate. Brazil surpassed the United States as the largest soybean supplier to China in 2013; its soybean production recently overtook U.S. output as well. Since 2018, ASF has flattened soybean demand growth in China. The combined impact of increased competition and slower demand growth has reduced U.S. soybean exports below where they would have been if ASF and a weak real were not present. Other feed ingredients, such as coarse grains, DDGs, and feeds and fodders have been important drivers of U.S. agricultural exports to China between 2012 and 2016 but have waned during 2017 through 2019 as China drew down its large corn stocks and discouraged imports of corn substitutes, including imposing high tariffs on U. S. DDGs and sorghum. U.S. sorghum exports started to rebound in 2020 after China waived tariffs on the grain as part of the Phase One Agreement.
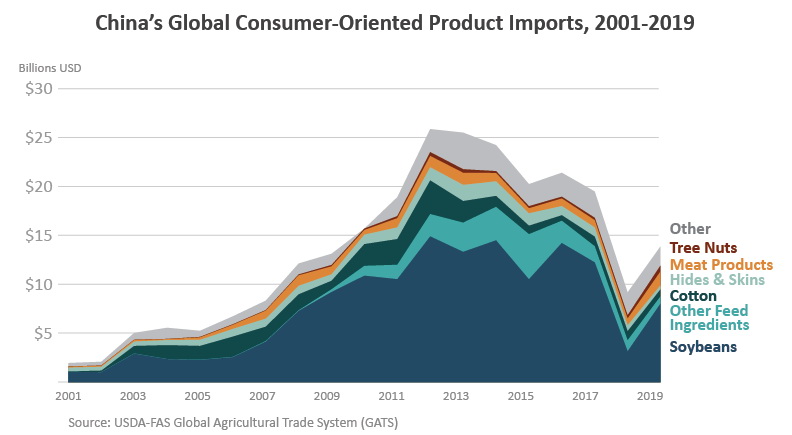
Cotton and hides used to account for a significant portion of U.S. exports to China. The country has the worlds largest textile and leather product industries, which are well known for their enormous exports and rising domestic use. However, Chinas import demand for both input materials has declined along with world demand for cotton and leather products, partly as use of synthetic or man-made materials gain market share.
Compared to bulk and intermediate commodities, U.S. exports of consumer-oriented products have maintained a growing trend, especially for meat, tree nuts, and prepared food. U.S. exports of pork and pork products to China more than quintupled over the last decade. China has periodically rejected U.S. pork exports from animals treated with ractopamine, a feed additive that promotes lean muscle growth in swine. In recent years, volatility in the Chinese pork industry, due to disease outbreaks and environmental regulations, has led to higher domestic prices and expansion in U.S. exports. Since regaining access to the Chinese market in 2017 (after the shut-out due to Bovine Spongiform Encephalopathy), U.S. beef exports have grown steadily. U.S. tree nut exports to China have expanded over 300 percent since 2010, with pistachios and almonds leading the growth. Processed food exports nearly quadrupled as Chinese consumers have shown a growing appetite for food preps, pastry products, and soup.
A notable exception to the growing consumer-oriented product exports is dairy, which experienced several setbacks in recent years. U.S. dairy exports grew rapidly between 2009 and 2013, led by nonfat dry milk and whey. In 2014, China issued Decree 145, which requires registration of overseas manufacturers. It caused problems for the U. S. Food and Drug Administration (FDA) by requiring attestation that the food product manufacturer is in compliance with the standards, laws, and regulations of China. Because the FDA does not commonly attest to foreign standards and was unable to meet the requirements, China did not register all U.S. dairy facilities exporting to China between May 2014 and July 2017.5 The issue was resolved when the United States and China signed a memorandum of understanding (MOU) in June 2017, and U.S. dairy exports to China rebounded that year. However, retaliatory tariffs imposed on U.S. dairy the last two years reduced U.S. dairy market share from 7 percent in 2017 to 4 percent in 2019. Compared to 10 years ago, however, U.S. dairy exports in 2019 were still up 58 percent in value.
Phase One Agreement, Covid-19 Pandemic, and Beyond
The signing of the U.S.-China Economic and Trade (Phase One) Agreement was January 15, 2020, , eight days before the central Chinese city of Wuhan went on lockdown to stem the spread of the novel coronavirus, followed days later by quarantine measures in much of the rest of the country. While the lockdown temporarily halted a wide swath of Chinese economic activities and led to an abrupt decline in household income and expenditure, food spending has been resilient, as consumers stepped up purchasing through e-commerce over traditional retail, and household expenditure on food actually increased two percent in the first quarter of the year compared to the same period in 2019.6 Chinas January-July imports were $12.4 billion above a year ago and $19.5 billion higher than 2017.
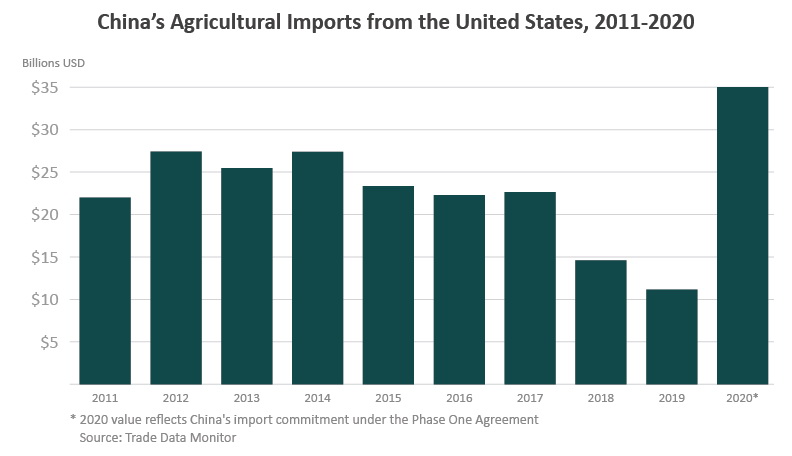
As part of the Phase One Agreement, China has committed to purchase $12.5 billion more agricultural and related products from the United States over 2017 levels.7 After a slow start in the first quarter, U.S. agricultural exports to China increased pace in April through July, with shipments exceeding seasonal trend. However, from January-July, U.S. agricultural exports to China were still 16 percent (or $1.3 billion) below the same period in 2017, largely due to lagging soybean shipments. Export sales of soybeans have accelerated in recent months, while sales and shipments of grains have also picked up steam.Year-to-date
U.S. consumer-oriented product exports to China have more than doubled from 2017 levels, led by record pork shipments. Chinas pork and pork product imports have more than tripled so far this year as ASF continues to put upward pressure on prices. While both the EU and the United States have captured some of the growth in Chinas pork market, Brazil managed to expand its market share from 3 percent in 2017 to 10 percent currently. Chinas beef imports also rose as domestic beef prices moved up in tandem with pork. South America, Australia, and New Zealand accounted for most of the beef supplies to China. Brazil has been shipping record value of beef there.
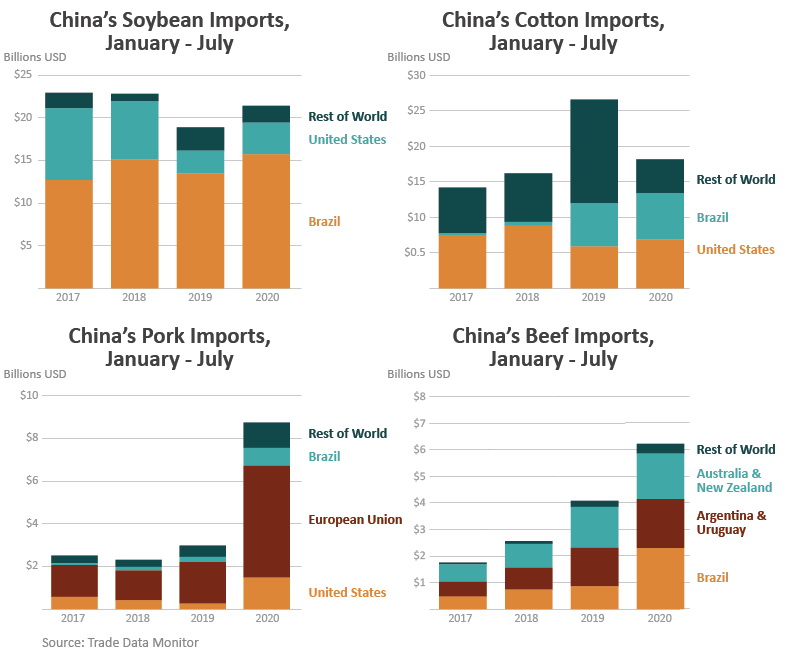
The trade data suggest that the biggest challenge facing U.S. agricultural trade with China thus far in 2020 is strong competition, especially from Brazil. It stands to note that, indirectly, the pandemic has led to a more favorable exchange rate for the Brazilian real, boosting the countrys competitiveness and helping it to ship record amounts of soybeans to China in the first half of the year. Meanwhile, China continues to implement its tariff exclusion process to facilitate importing U.S. commodities. It has updated lists of U.S. facilities eligible to export beef, pork, poultry, seafood, dairy, and infant formula products. As a result of these actions, more U.S. facilities are eligible to export U.S. agricultural products to China than ever before.8
Chinas economy has been slowly recovering from its months-long lockdown. July industrial output grew 4.4 percent from a year ago, expanding for the fourth straight month. The World Bank projects Chinas Gross Domestic Production (GDP) growth for 2020 to be 1.0 percent. Other organizations, such as Morgan Stanley and Oxford Economics, are forecasting a range of 2.0 to 2.5 percent. In contrast, the World Bank expects Emerging Market and Developing Economies (EMDMs) GDP to contract 2.5 percent this year, while GDP of Advanced Economies projects a shrinkage of 7 percent. According to the World Bank, Chinas GDP growth expects to bounce back to 6.9 percent in 2021- 0.8 percentage point above the pre-pandemic 2019 level.
The pandemic notwithstanding, China projects to have one of the fastest economic growth rates in the world, and the country expects to add 189 million middle-class households in the coming decade, which means rising demand for meat, dairy, and other food and beverages. However, lagging growth in domestic supply, shortage of capital investment, competition for land use from urbanization and industrialization, and increasing cost of labor and inputs will lead to higher prices and fuel continued growth in imports. The shifting patterns of Chinas agricultural imports in recent years point to a dynamic growth market. For many years, soybeans have been the engine of growth for U.S. agricultural exports. It is unlikely that U.S. soybean exports will recapture its past dominance in the Chinese market anytime soon. The challenge for U.S. agricultural exports is finding a way to evolve and grow along with Chinas import demand.
1 Calculated based on USDA PSD consumption and World Bank population data.
2 Gale, Fred, James Hansen, and Michael Jewison. Chinas Growing Demand for Agricultural Imports, EIB-136, U. S. Department of Agriculture, Economic Research Service, February 2014.
3 Ibid.
4 Gooch, Elizabeth, Roger Hoskin, and Jonathan Law. Chinas Dairy Supply and Demand, LDPM-282–01 USDA, Economic Research Service, December 2017.
5 Ibid.
6 USDA ERS analysis of data from China National Bureau of Statistics.
7 This report does not cover seafood, included in the Phase One Agreement.8 https://www.usda.gov/media/press-releases/2020/05/21/usda-and-ustr-announce-continued-progress-implementation-us-china